Coding dynamic dashboard applications (with R & Shiny)
This page contains teaching material for a course on dynamic dashboards.
Sessions
The links below lead to html slides and course material.
Introduction to R/RStudio and the tidyverse (tidying with tidyr, wrangling with dplyr): slides and sample notebook in RMarkdown or in html
Basic R instructions (matrices, dataframes, indexing, data modes): slides, sample notebook and exercise notebook
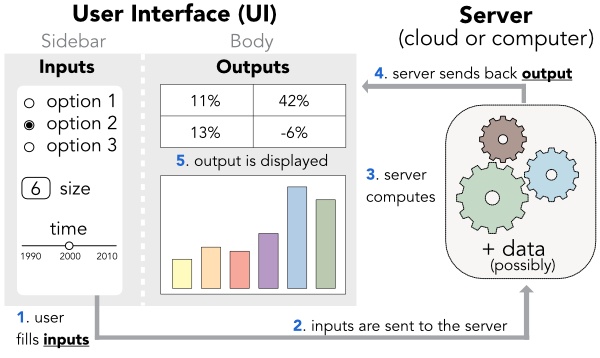
Shiny 1 (User Interface & Server dialog): slides and exercises. More importantly: the examples.
Shiny 2 (User Interface layout): slides and exercises. More importantly: the examples.
Shiny 3 (Further options & deployment): slides and more importantly: the examples.
Geocomputing, Twitter data & simple text mining: notebook for maps and notebook for Mastodon text analysis + all files for the maps.
Modelling & case study: all files (zipped).
Datasets
The datasets used in the course: songs, movies and olympics. Don’t forget to locate them in the app/notebook directory.
Resources
Mastering shiny: Hadley Wickham’s book.
Shiny tutorials: efficient material (by RStudio).
Shiny dashboard: the package’s webpage.
DISCLAIMER: the data and code are meant for pedagogical use only.